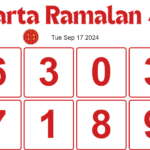
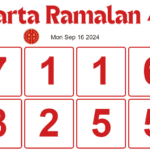
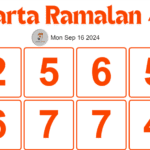
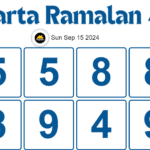
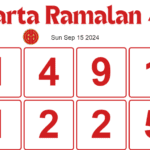
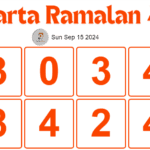
Prediction charts are valuable tools used in lottery games to help players make informed decisions about their number selections. By analysing historical data and applying various statistical techniques, prediction charts aim to identify patterns, trends, and potential future outcomes. This guide delves into the detailed process of creating prediction charts, offering insights into the methods, tools, and best practices used to develop effective charts.
1. Data Collection
Gathering Historical Data
The foundation of any prediction chart is historical data. This data includes past lottery results, draw frequencies, and any other relevant information.
- Sources: Data can be collected from official lottery websites, historical archives, or third-party data providers. Reliable sources ensure the accuracy and completeness of the data.
- Types of Data: Key data points include draw dates, winning numbers, jackpot amounts, and prize distributions. For more detailed analysis, you might also collect data on the frequency of specific numbers, combinations, and patterns.
Data Preparation
Once collected, the data must be cleaned and organized to facilitate analysis.
- Data Cleaning: Remove duplicates, correct errors, and ensure consistency in data formats. This step is crucial to avoid inaccuracies in the analysis.
- Data Organization: Structure the data in a usable format, such as spreadsheets or databases. Organize it by draw date, number combinations, and other relevant categories.
2. Statistical Analysis
Frequency Analysis
Frequency analysis examines how often specific numbers or combinations appear in the historical data.
- Single Number Frequency: Count how often each number has been drawn. This helps identify which numbers are “hot” (frequently drawn) and which are “cold” (rarely drawn).
- Combination Frequency: Analyze the frequency of specific number combinations. This can reveal patterns in how numbers are drawn together.
Trend Analysis
Trend analysis focuses on identifying patterns and trends over time.
- Long-Term Trends: Examine trends over extended periods to identify recurring patterns or anomalies. For example, some numbers may show a tendency to appear more frequently in certain months or seasons.
- Short-Term Trends: Analyze recent draws to identify any short-term patterns. This can help in making predictions based on recent data.
Pattern Recognition
Pattern recognition involves identifying specific sequences or arrangements of numbers that frequently occur.
- Common Patterns: Look for common patterns, such as consecutive numbers, repeating sequences, or specific number groupings.
- Anomalies: Identify any unusual patterns or deviations from the norm. Understanding these anomalies can provide insights into potential future outcomes.
3. Predictive Modeling
Mathematical Models
Mathematical models use statistical techniques to forecast future lottery results based on historical data.
- Regression Analysis: Apply regression models to predict future numbers based on past trends and patterns. This method helps identify relationships between variables and forecast outcomes.
- Probability Models: Use probability theory to calculate the likelihood of specific numbers or combinations being drawn. This can help assess the chances of winning for different number selections.
Machine Learning Models
Machine learning algorithms can be employed to enhance prediction accuracy by learning from historical data and identifying complex patterns.
- Supervised Learning: Train models using labeled data (historical results) to predict future outcomes. Algorithms such as decision trees, neural networks, and support vector machines can be used.
- Unsupervised Learning: Use clustering and association techniques to discover hidden patterns and relationships in the data without predefined labels.
4. Chart Creation
Designing the Chart
Once the analysis and modeling are complete, the next step is to create the prediction chart.
- Chart Types: Choose appropriate chart types based on the data and the insights you want to convey. Common types include bar charts, line graphs, and scatter plots.
- Visualization Tools: Use visualization tools such as Excel, Google Sheets, Tableau, or specialized charting software to create and customize your charts.
- User Interface: Ensure that the chart is user-friendly and easy to interpret. Include clear labels, legends, and titles to help users understand the data.
Incorporating Predictions
Integrate the predictions into the chart, highlighting potential number selections or combinations.
- Probability Scores: Display probability scores or likelihoods for each number or combination. This helps users make informed decisions based on predicted chances of winning.
- Trends and Patterns: Include annotations or highlights to show significant trends or patterns identified in the analysis.
5. Validation and Refinement
Testing Predictions
Validate the accuracy of the prediction chart by comparing its predictions with actual draw results.
- Backtesting: Apply the prediction chart to historical data to see how well it would have performed in past draws. This helps assess the reliability of the predictions.
- Adjustments: Refine the chart based on testing results. Adjust the models and analysis techniques to improve prediction accuracy.
Continuous Improvement
Prediction charts should be updated regularly to incorporate new data and refine predictions.
- Ongoing Data Collection: Continuously collect and analyze new draw results to keep the chart current and accurate.
- Model Updates: Update the predictive models as needed to account for changes in trends and patterns.
6. Best Practices
Transparency and Accuracy
Ensure transparency in the methods and data used for creating prediction charts.
- Documentation: Provide clear documentation of the methodologies and data sources used in the prediction chart. This helps users understand and trust the predictions.
- Accuracy: Strive for accuracy in the analysis and modeling to provide reliable predictions.
Responsible Use
Encourage responsible use of prediction charts and remind users that lottery outcomes are inherently random.
- Gambling Awareness: Educate users about the risks of gambling and the importance of responsible play.
- No Guarantees: Emphasize that prediction charts provide insights based on historical data but cannot guarantee winning outcomes.
Conclusion
Creating prediction charts involves a detailed process of data collection, statistical analysis, predictive modeling, and chart design. By employing rigorous methodologies and continuously refining the charts, you can provide valuable tools for lottery players to make informed decisions. Remember to focus on accuracy, transparency, and responsible use to ensure the effectiveness and reliability of your prediction charts.
